Blinkit Sales Analysis Dashboard
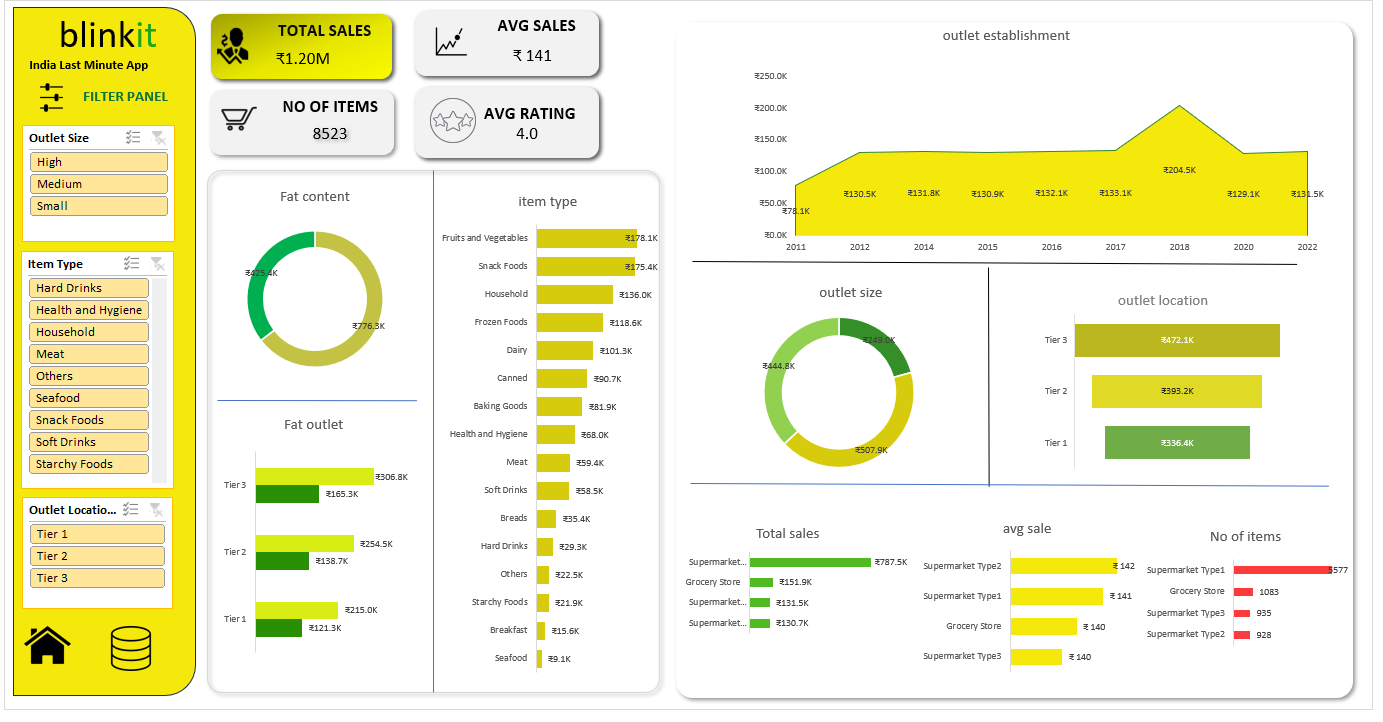
Interactive dashboard analyzing sales performance, product trends, outlet performance and business insights.
- Power BI
- Data Cleaning
- DAX
- Data Visualization
Project Overview
A Power BI dashboard exploring Blinkit sales data across outlets, item categories and outlet characteristics to surface business performance drivers.
Problem Statement
Understand which outlet types, sizes, locations and product categories drive sales, and where performance can be improved.
Dataset
Blinkit sales dataset containing item attributes, outlet attributes, ratings and sales values.
Tools & Technologies
- Power BI
- Data Cleaning
- DAX
- Data Visualization
Data Cleaning
- Handled missing values in item weight and outlet size
- Standardised inconsistent fat-content category labels
- Validated numeric sales and rating columns
Data Analysis
- Total sales, average sales, item count and average rating
- Sales split by item type, fat content and outlet tier
- Outlet establishment-year trend analysis
Methodology
- Imported and transformed the dataset in Power Query
- Created DAX measures for the core KPIs
- Designed an interactive report page with slicers and cross-filtering
Key Insights
- A handful of item categories account for a large share of total sales
- Outlet size and location tier are strongly associated with sales performance
- Ratings stay consistent across categories, so quality is not the differentiator
Visualizations
- KPI cards for total sales, average sales, items and rating
- Category and fat-content breakdowns
- Outlet type, size and location analysis
Results
- An interactive Power BI report for outlet and category performance review
- Reusable DAX measures for ongoing sales monitoring