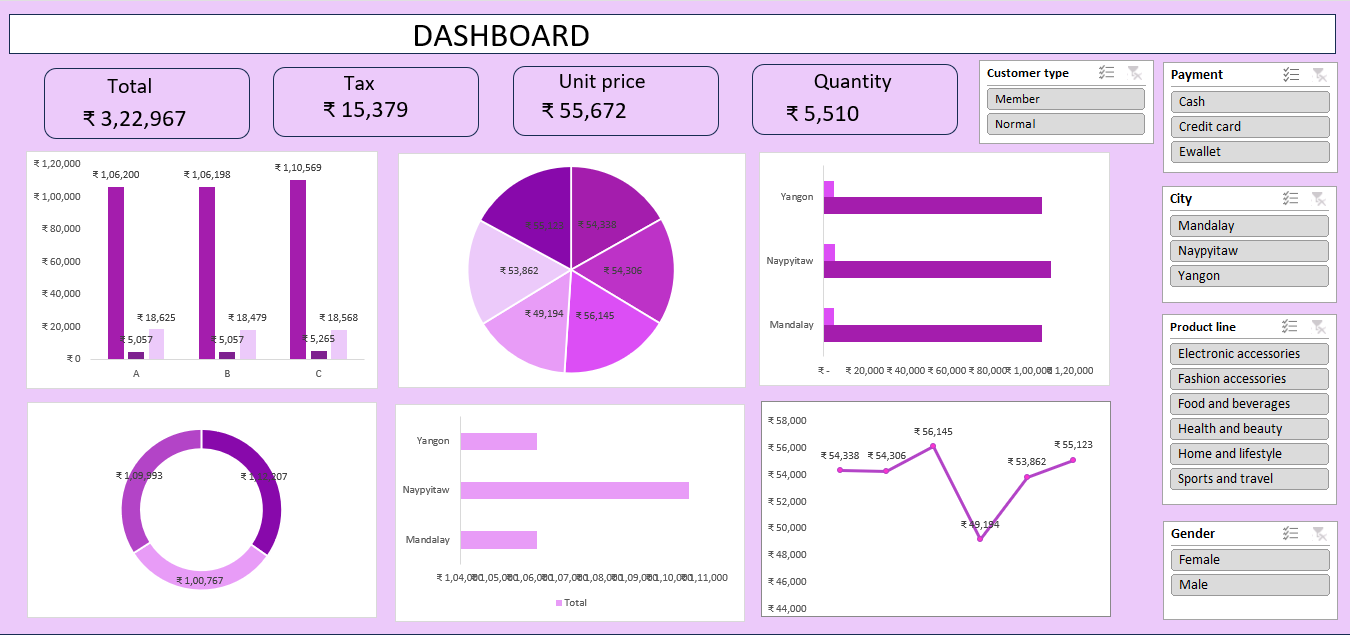
Interactive dashboard for analyzing sales, profit, quantity and business performance across locations, industries and time periods.
- Excel
- Pivot Tables
- Charts
- Slicers
- Data Analysis
BE CSE (AI & ML) Student • Aspiring Data Analyst
I'm a 3rd-year Computer Science Engineering student specializing in Artificial Intelligence & Machine Learning, passionate about data analytics, visualization, and turning raw data into meaningful business insights.

Profile
I'm a 3rd-year Computer Science Engineering student specializing in Artificial Intelligence & Machine Learning, passionate about data analytics, visualization, and turning raw data into meaningful business insights.
B.E. Computer Science and Engineering
(AI & Machine Learning)
Jeppiaar Engineering College
Selected portfolio
Tools and technologies I use to analyze, visualize and understand data.
Selected portfolio
Data analytics and machine learning projects showcasing practical skills.

Interactive dashboard for analyzing sales, profit, quantity and business performance across locations, industries and time periods.

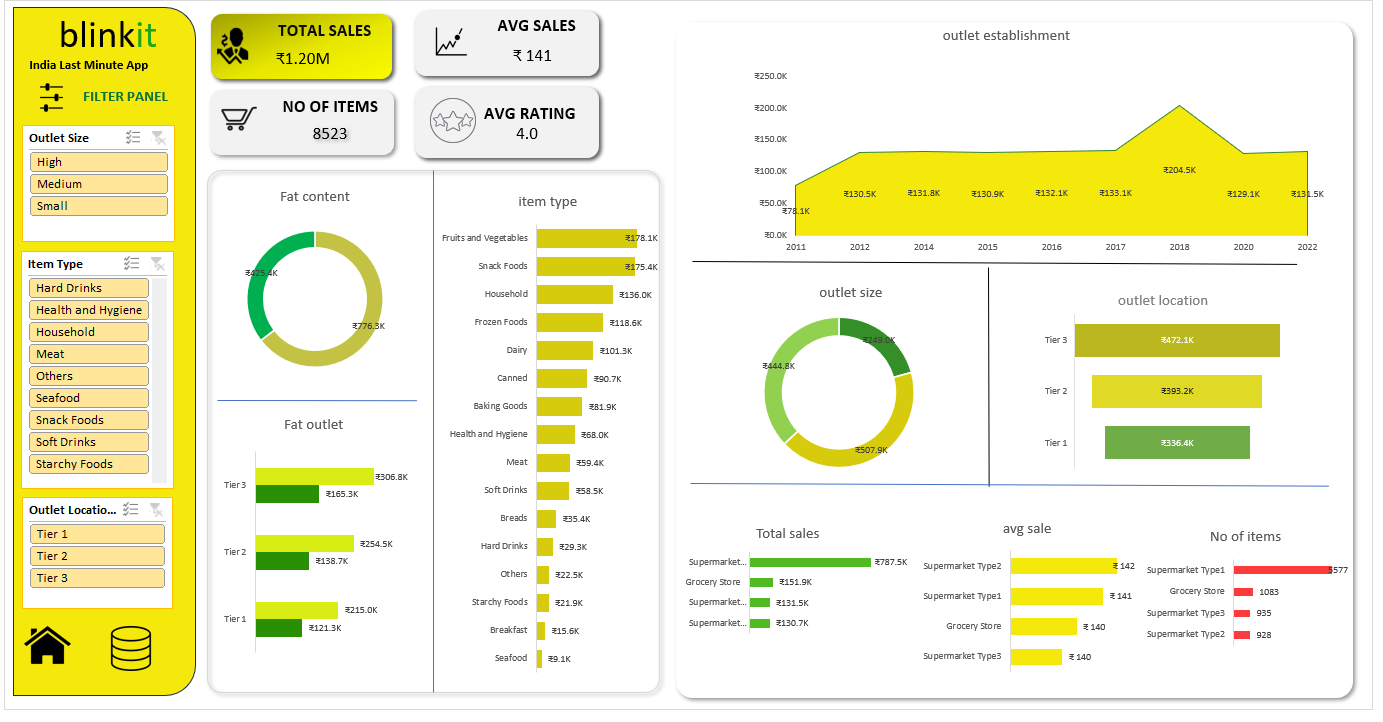
Interactive dashboard analyzing sales performance, product trends, outlet performance and business insights.

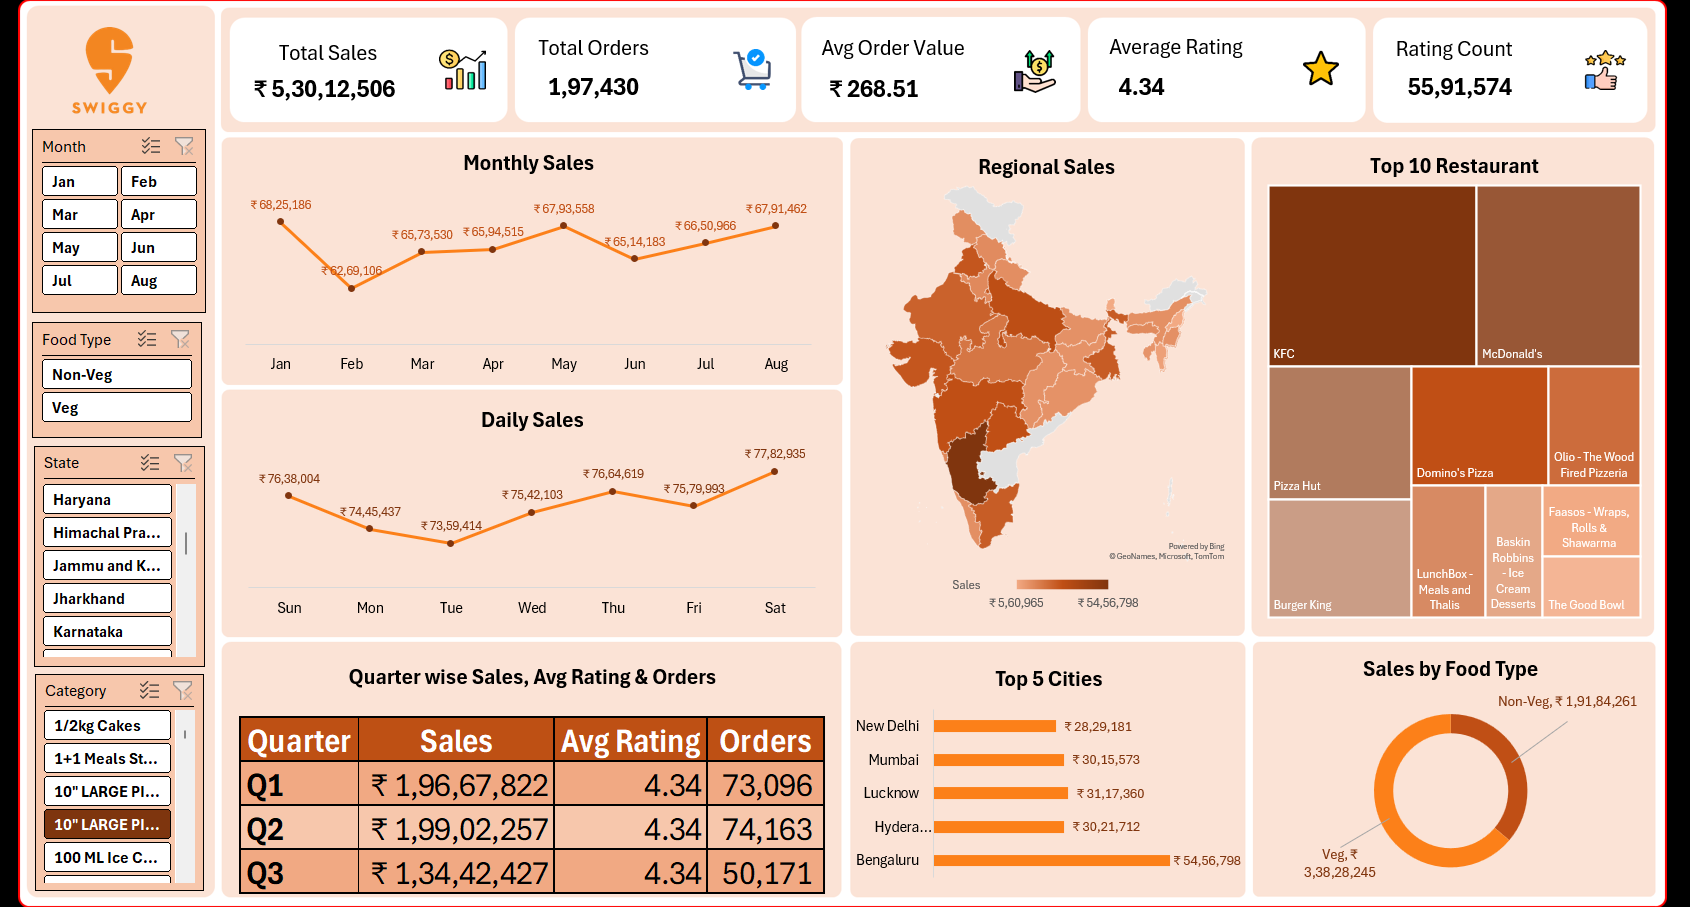
Interactive food-delivery analytics dashboard designed to identify sales trends, customer patterns and business insights.

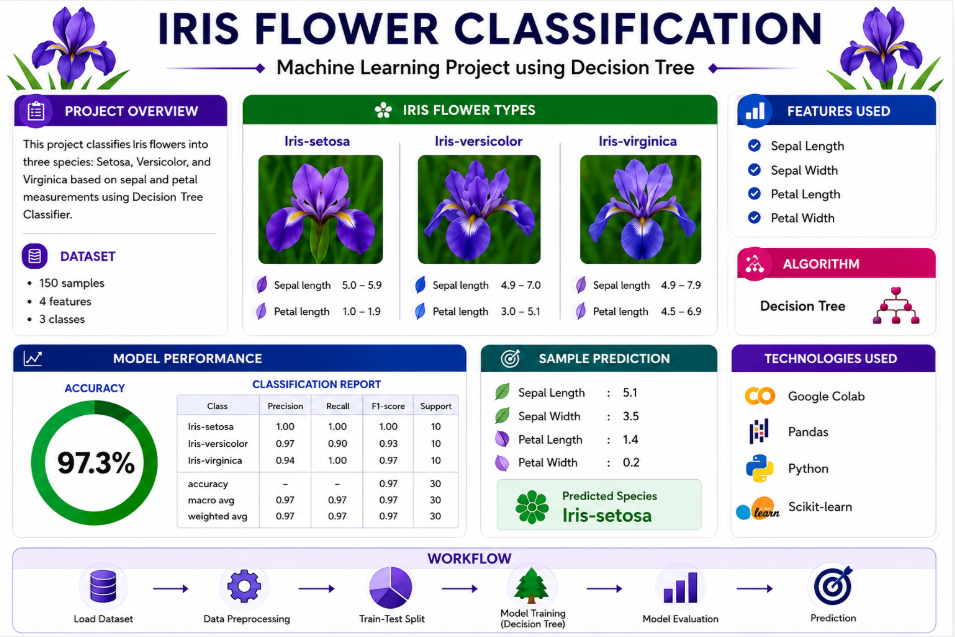
Machine learning model that predicts the Iris flower species using four flower measurements.
Selected portfolio
Continuous learning for a better tomorrow
IBM / Coursera
Infosys Springboard
Novitech Pvt Ltd
IBM / Coursera
IBM / Coursera
IBM / Coursera
Let's connect and discuss data, analytics and opportunities.