Swiggy Data Analysis Dashboard
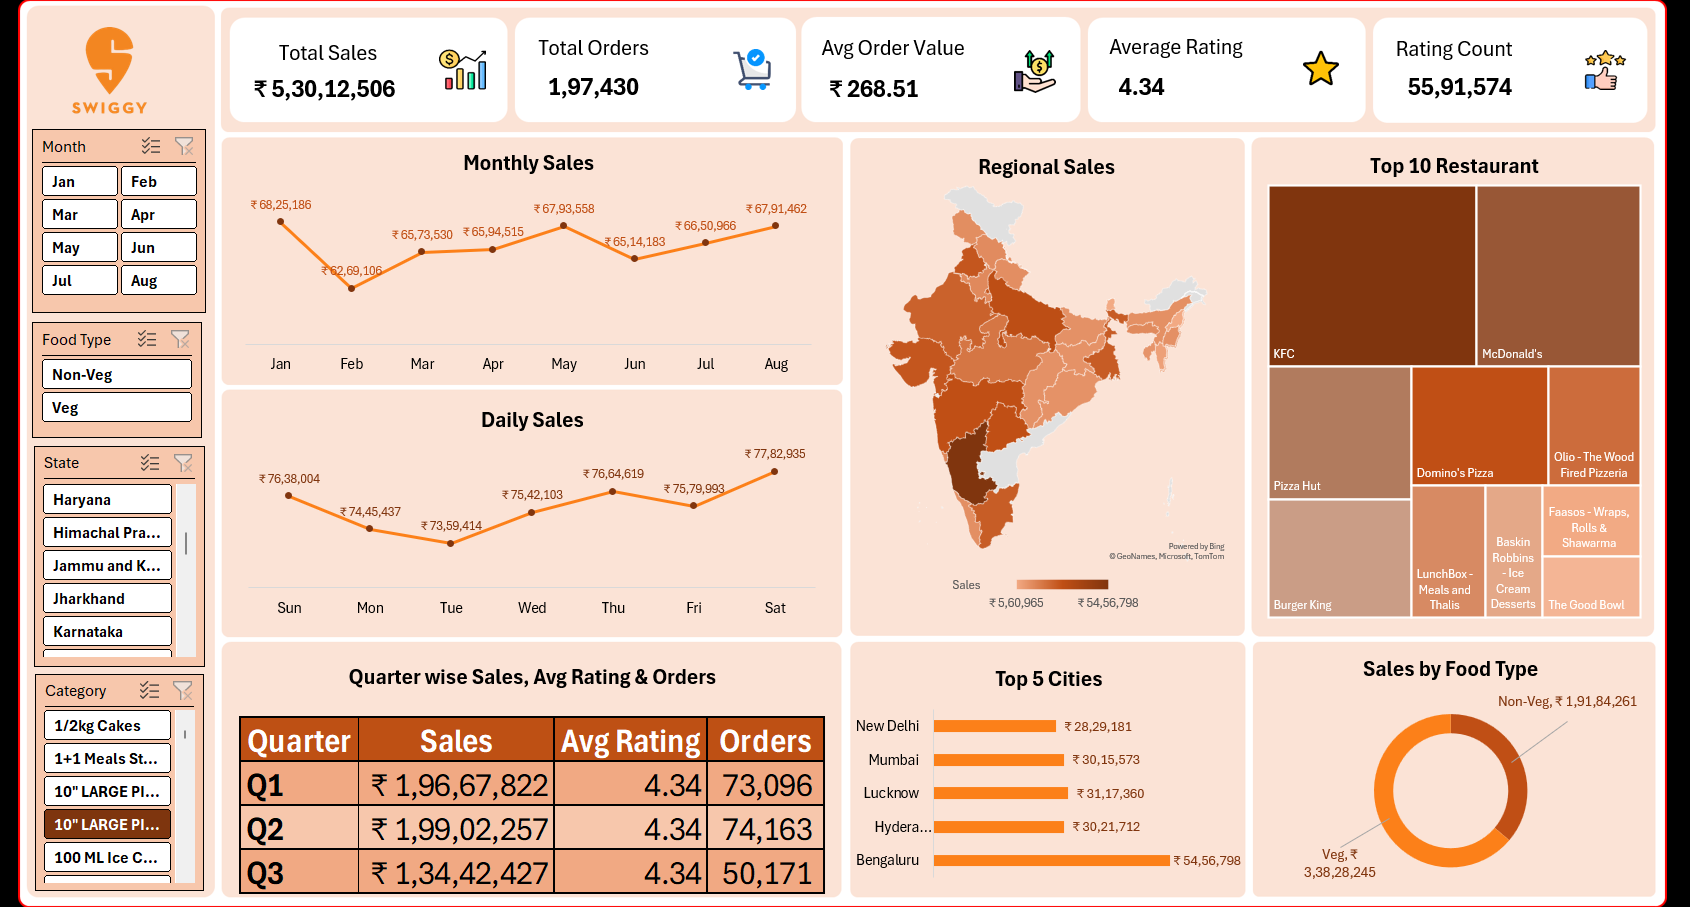
Interactive food-delivery analytics dashboard designed to identify sales trends, customer patterns and business insights.
- Power BI
- Excel
- Data Analysis
- Data Visualization
Project Overview
A food-delivery analytics dashboard that studies restaurant, city and cuisine level performance along with customer rating behaviour.
Problem Statement
Identify what drives orders and ratings across cities, cuisines and restaurants in a food-delivery marketplace.
Dataset
Swiggy restaurant and order dataset covering city, cuisine, pricing, ratings and delivery details.
Tools & Technologies
- Power BI
- Excel
- Data Analysis
- Data Visualization
Data Cleaning
- Removed duplicate restaurant entries
- Normalised cuisine and city text values
- Converted rating and price fields to consistent numeric formats
Data Analysis
- City-level and cuisine-level performance comparison
- Rating distribution and its relationship with price
- Top-performing restaurants by volume and rating
Methodology
- Prepared and cleaned the raw data in Excel
- Modelled and visualised the cleaned data in Power BI
- Added slicers for city, cuisine and rating range
Key Insights
- Order concentration is heavily skewed toward a few cities
- Popular cuisines differ noticeably between cities
- Higher price does not guarantee a higher rating
Visualizations
- KPI cards for restaurants, average rating and average price
- City and cuisine comparison charts
- Rating distribution visual
Results
- A dashboard that highlights growth cities and cuisines
- Clear view of rating and pricing patterns across the marketplace