Sales Analytics Dashboard
Interactive dashboard for analyzing sales, profit, quantity and business performance across locations, industries and time periods.
- Excel
- Pivot Tables
- Charts
- Slicers
- Data Analysis
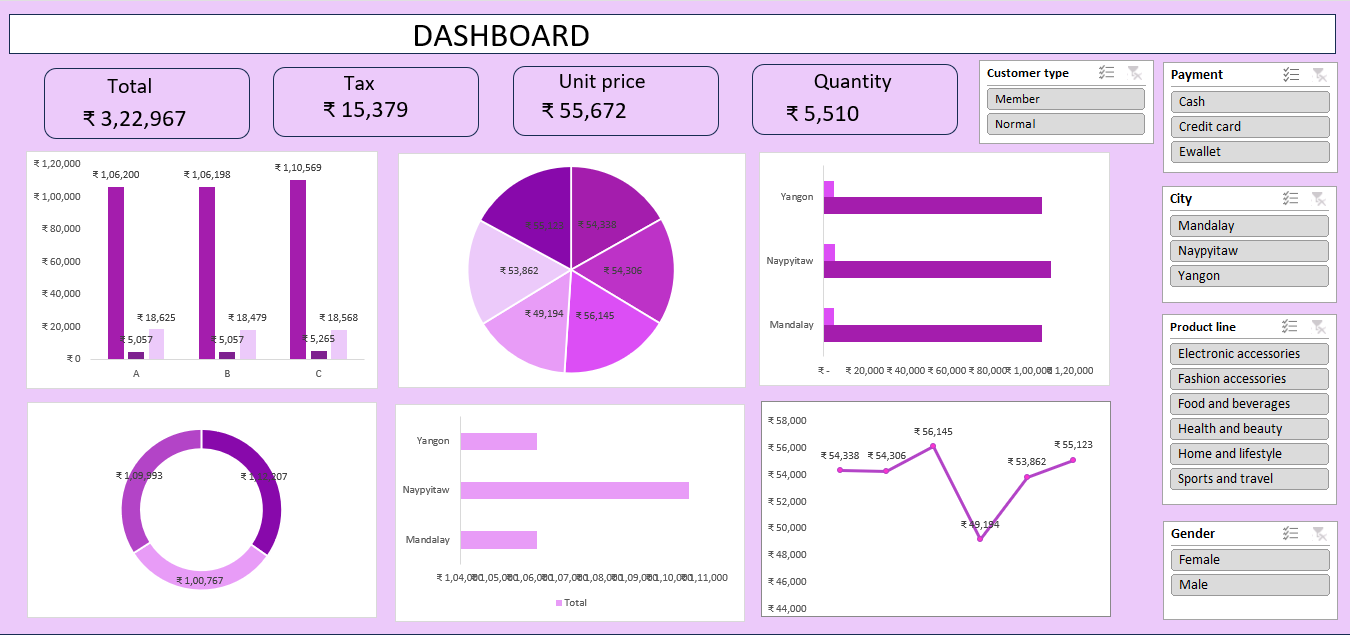
Project Overview
An Excel-based sales analytics dashboard that consolidates transactional sales data into a single interactive view of revenue, profit and quantity performance.
Problem Statement
Sales data spread across many rows makes it hard to see how performance varies by location, industry and time period. The goal was a single dashboard that answers those questions instantly.
Dataset
Sales transaction records containing order details, location, industry, quantity, sales value and profit.
Tools & Technologies
- Excel
- Pivot Tables
- Charts
- Slicers
- Data Analysis
Data Cleaning
- Removed duplicate and incomplete order records
- Standardised date, location and industry fields
- Corrected data types for numeric sales, quantity and profit columns
Data Analysis
- Sales and profit trends across time periods
- Performance comparison by location and industry
- Quantity and profit-margin analysis
Methodology
- Structured the cleaned data as an Excel table
- Built pivot tables for each analytical question
- Connected charts and slicers to create an interactive dashboard layout
Key Insights
- Revenue and profit are concentrated in a small set of locations and industries
- Clear seasonality is visible across the analysed time periods
- High sales volume does not always translate into high profit
Visualizations
- KPI cards for total sales, profit and quantity
- Trend charts by time period
- Location and industry comparison charts
Results
- A single interactive Excel dashboard replacing manual reporting
- Slicer-driven filtering by location, industry and period